NATURGREEN paper tables & figure (appendix)
Michael D Garber
2022-05-24
Filename: tables_figs_appendix
This document contains supplementary material, mostly tables and figures, as well as some additional text and description.
The URL for this page is https://michaeldgarber.github.io/green-space-denver/tables_figs_appendix.html
1 Demographics of Denver and study area
1.1 Table describing demographics of Denver and the study area
| Measure | Denver | Study |
|---|---|---|
| Area (sq. mi.) | 154.70 | 99.90 |
| Population | 715878.00 | 635240.00 |
| Population density (per sq. mi.) | 4627.61 | 6358.73 |
| Proportion White race | 0.54 | 0.59 |
| Proportion Black race | 0.09 | 0.07 |
| Proportion Hispanic or Latino race | 0.30 | 0.27 |
| Proportion other race | 0.07 | 0.07 |
| Median age (years) | 34.70 | 35.10 |
| Proportion in poverty, last 12 mos. | 0.12 | 0.12 |
| Median household income (USD) | 73003.00 | 73489.00 |
| Estimated all-cause mortality rate per 1,000 | 10.16 | 10.40 |
| Median block-group area (sq. mi.) | 0.14 | 0.13 |
1.2 Map population density by block group
1.3 Map median age by census tract
1.4 Map race (proportion non-white) by census tract
1.5 Map percent in poverty in last 12 months by census tract
1.6 Map median household income by census tract
2 Native-plants polygons
2.1 Map of native-plants polygons
2.2 NDVI of native-plants polygons
| Place type | Place name | Area (acres) | Area (sq. mi.) | NDVI, mean | NDVI, 25th-ile | NDVI, 50th-ile | NDVI, 75th-ile |
|---|---|---|---|---|---|---|---|
| high diversity | Chatfield Meadow Restoration | 0.1 | 0.00 | 0.48 | 0.47 | 0.50 | 0.50 |
| high diversity | Chatfield Prairie Garden | 0.1 | 0.00 | 0.37 | 0.35 | 0.37 | 0.37 |
| high diversity | City Park Greenhouses | 0.2 | 0.00 | 0.31 | 0.27 | 0.28 | 0.28 |
| high diversity | Denver Botanic Gardens Green Roof | 0.3 | 0.00 | 0.34 | 0.34 | 0.36 | 0.36 |
| high diversity | Kenderick Lake Xeriscape Garden | 0.8 | 0.00 | 0.40 | 0.36 | 0.37 | 0.37 |
| native spectrum | Denver Botanic Gardens, 100% Native | 0.5 | 0.00 | 0.54 | 0.52 | 0.55 | 0.55 |
| native spectrum | Plains Conservation Center, 100% Native | 18.2 | 0.03 | 0.16 | 0.23 | 0.26 | 0.26 |
| native spectrum | Green Mountain Park, 85% Native | 1917.7 | 3.00 | 0.42 | 0.36 | 0.40 | 0.40 |
| native spectrum | Hogback along C-470, 75% Native | 29.7 | 0.05 | 0.36 | 0.32 | 0.35 | 0.35 |
| native spectrum | Suburban Open Space 1, Chatfield H.S., 50% Native | 3.7 | 0.01 | 0.40 | 0.37 | 0.41 | 0.41 |
| native spectrum | Suburban Open Space 2, Columbine Hills Church, 30% Native | 4.6 | 0.01 | 0.36 | 0.26 | 0.31 | 0.31 |
| native spectrum | Denver Botanic Gardens at Chatfield, 10% Native | 2.2 | 0.00 | 0.53 | 0.40 | 0.54 | 0.54 |
| native spectrum | City Park, 0% Native | 61.2 | 0.10 | 0.67 | 0.67 | 0.70 | 0.70 |
3 Visualization of scenarios
Note to self: This section is mostly copied from ~green-space-denver/docs/hia-results.Rmd
3.1 Scenario 1: fixed proportion of all block groups
The weighted block-group-level mean NDVI on July 4, 2021 is presented here.
Figure 3.1: Mean normalized difference vegetation index (NDVI) of census block groups in Denver, Colorado (excluding some in the northeast, described in main text) on July 4, 2021 as measured by the Landsat-8 satellite on July 4, 2021. NDVI is measured at a spatial resolution of 30 meters squared. The weighted block-group-level mean NDVI is weighted by the proportion Landsat pixels overlap the water-free land area of the block group
For each definition of native-plants NDVI, We excluded census blocks whose baseline NDVI was above the threshold. The following map categorizes census block groups by at the NDVI cutoffs of 0.34, 0.42, and 0.54:
3.2 Scenario 2: riparian areas
We measured NDVI in a 200-foot buffer, a 100-foot buffer, and a 50-foot buffer around all bodies of water in Denver. We downloaded bodies of water from OpenStreetMap (code here). We defined residential exposure to these riparian areas as those individuals living within a 500-meter buffer.
The below map depicts mean NDVI in the portions of census block groups that intersect a 200-foot buffer as well as those pieces that intersect the part of the 500 m buffer that would not be intervened upon, i.e., the part between the 200-foot buffer and the edge of the 500 m residential buffer.
3.3 Scenario 3: green infrastructure
3.3.1 Scenario 3.1. stormwater retention projects
We were provided a list of planned projects throughout Denver. Per our conversations, we assume that about 75% of the project’s footprint would consist of native or vegetation. Like for riparian areas, we defined exposure to the projects as those individuals living within a 500 m buffer of the projects. A map of baseline NDVI of the projects themselves and of a 500 m residential buffer around the projects is below.
3.3.2 Scenario 3.2. Site new or re-development storwmater controls
A regulatory scenario suggested by this agency is stormwater controls on new and re-development to offset the negative impacts to flooding and water quality due to the increase in impervious surfaces added by development. These stormwater control measures would add vegetation using native or adapted plants. The approach for estimating the health impact of the redevelopment controls is distinct in that we will not know where the re-developments will occur. We thus simulated possible locations. Per our conversations with the stakeholder, we anticipate the following number of parcels will be subject to these rules per year:
- greater than 1 acre: about 100 sites per year
- 0.5-1.0 acre: about 25 sites per year
- less than 0.5 acre: 400 sites per year
We gathered data on parcels from Denver’s Open Data Portal (Existing Landuse 2018) and measured their area. A subset of these parcels near Union Station is mapped below. (Mapping all parcels is too much data to present.)
Then, from all parcels, we sampled 100 sites of size greater than 1 acre, 25 sites of size 0.5-1 acre, and 400 sites less than 0.5 acres. One such sample appears below.
From this point, we followed the same framework as for other scenarios. The baseline NDVI of the sampled parcels and that of their corresponding 500m buffers is visualized below.
3.4 Scenario 4: parking lots
Finally, we propose replacing a portion of parking-lot surface with native plants. Denver’s area is about 9% parking lot (below table). We obtained spatial data on parking lots from the City of Denver Open Data Catalog.1
| Total area (mi2), parking lots | Total area (mi2), Denver | proportion parking lots |
|---|---|---|
| 13.57 | 155 | 0.09 |
We similarly measured the NDVI on the parking lots as well as the NDVI in the census block groups within a 500-m buffer radius of any parking lot (which is almost the whole city). We present a subset of these areas in a 2-mile radius around Union Station (the complete data are too large to upload):
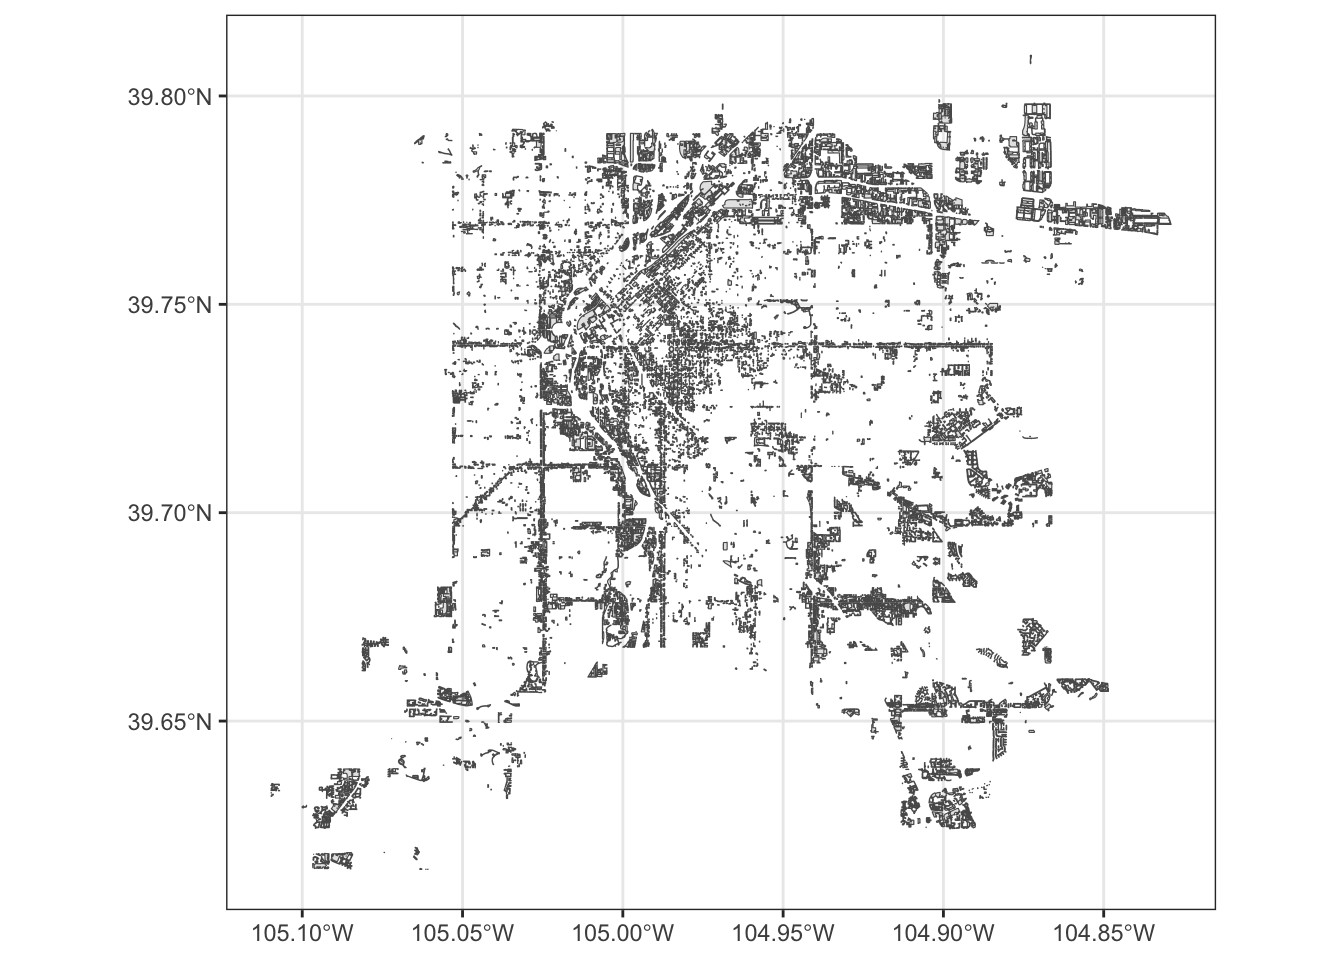
Due to space constraints, we cannot map each parking lot interactively on this website. Below is a static map of the parking lots in the Denver study area.
4 Stratified analyses by equity indices
Both the State of Colorado and the City of Denver have created equity indices to guide their work. The Colorado Department of Public Health & Environment (CDPHE) describes their equity index here2 and makes the index available for download here.3 The City of Denver Department of Public Health & Environment (DDPHE) describes the neighborhood-level equity index here4 and makes the data available for download here.5
Note that for the CDPHE index, a higher score is a worse score, whereas for the DDPHE index, a lower score is a worse score. The map below presents tertiles of each score.
4.1 Maps of equity indices
Below are results of a chi-square test comparing tertiles of CDPHE Equity Index vs the DDPHE Equity index.
##
## Pearson's Chi-squared test
##
## data: table(compare_tertiles$equity_bg_cdphe_tertile_den, compare_tertiles$equity_nbhd_denver_tertile)
## X-squared = 319.81, df = 4, p-value < 2.2e-164.2 Scatterplot of equity and NDVI at the block-group level
The horizontal lines correspond to the three NDVI defitions of native plants. The blue line is the linear line of best fit, showing a slight positive association between NDVI and equity scre, where a lower equity score indicates more disadvantage.
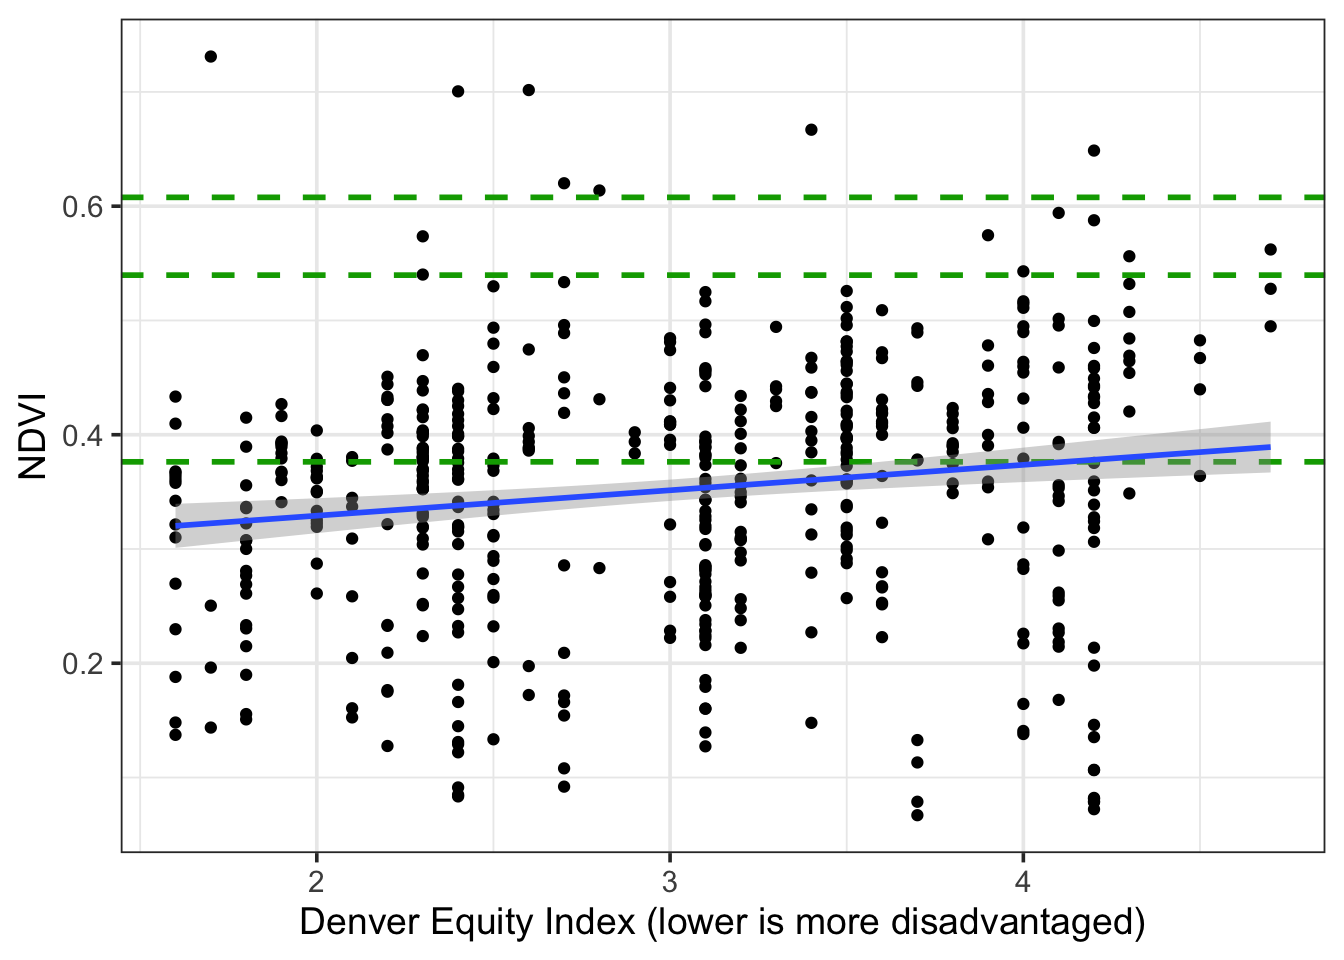
The linear correlation between equity score and NDVI of the census block groups is positive but fairly weak.
den_co_bg_pop_per_ndvi_equity_linked = den_co_bg_pop_per_ndvi %>%
dplyr::select(-tract_fips) %>%
link_equity_indices() %>%
st_set_geometry(NULL)
cor(den_co_bg_pop_per_ndvi_equity_linked$equity_nbhd_denver,
den_co_bg_pop_per_ndvi_equity_linked$ndvi_mean_wt)## [1] 0.15699155 Supplementary tables
Note for internal reference that these tables are output in Word here: ~green-space-denver/docs-for-word/tables-appendix.Rmd
5.1 Table 1: Description of scenarios (area, pop affecteds)
| Scenario num. | Scenario | Sub-scenario | Equity Tertile | Area, treatment (mi2), median (95% UI) | Area, residential buffer (mi2), median (95% UI) | Prop. of residential buffer treated, median (95% UI) | Pop. affected, estimate (95% UI) |
|---|---|---|---|---|---|---|---|
| 1 | Block-group level | 100-pct | NA | 93.1 (51.2, 95.5) | 93.1 (51.2, 95.5) | 1.00 (1.00, 1.00) | 385,389 (199,323; 394,491) |
| 1 | Block-group level | 100-pct | [1.6,2.5] | 35.2 (25.2, 35.8) | 35.2 (25.2, 35.8) | 1.00 (1.00, 1.00) | 141,813 (88,150; 145,540) |
| 1 | Block-group level | 100-pct | (2.5,3.5] | 29.4 (11.4, 29.4) | 29.4 (11.4, 29.4) | 1.00 (1.00, 1.00) | 143,017 (63,682; 146,575) |
| 1 | Block-group level | 100-pct | (3.5,4.7] | 28.5 (14.6, 30.3) | 28.5 (14.6, 30.3) | 1.00 (1.00, 1.00) | 100,559 (44,470; 106,950) |
| 1 | Block-group level | 30-pct | NA | 93.1 (51.2, 95.5) | 93.1 (51.2, 95.5) | 1.00 (1.00, 1.00) | 385,389 (198,922; 393,694) |
| 1 | Block-group level | 30-pct | [1.6,2.5] | 35.2 (25.2, 35.8) | 35.2 (25.2, 35.8) | 1.00 (1.00, 1.00) | 141,813 (88,656; 145,743) |
| 1 | Block-group level | 30-pct | (2.5,3.5] | 29.4 (11.4, 29.4) | 29.4 (11.4, 29.4) | 1.00 (1.00, 1.00) | 143,017 (63,718; 146,848) |
| 1 | Block-group level | 30-pct | (3.5,4.7] | 28.5 (14.6, 30.3) | 28.5 (14.6, 30.3) | 1.00 (1.00, 1.00) | 100,559 (44,723; 105,748) |
| 1 | Block-group level | 20-pct | NA | 93.1 (51.2, 95.5) | 93.1 (51.2, 95.5) | 1.00 (1.00, 1.00) | 385,389 (198,534; 394,455) |
| 1 | Block-group level | 20-pct | [1.6,2.5] | 35.2 (25.2, 35.8) | 35.2 (25.2, 35.8) | 1.00 (1.00, 1.00) | 141,813 (87,956; 146,019) |
| 1 | Block-group level | 20-pct | (2.5,3.5] | 29.4 (11.4, 29.4) | 29.4 (11.4, 29.4) | 1.00 (1.00, 1.00) | 143,017 (63,779; 146,319) |
| 1 | Block-group level | 20-pct | (3.5,4.7] | 28.5 (14.6, 30.3) | 28.5 (14.6, 30.3) | 1.00 (1.00, 1.00) | 100,559 (44,698; 106,966) |
| 2 | Riparian areas | 200-ft | NA | 5.4 (2.4, 6.1) | 39.5 (20.0, 43.4) | 0.14 (0.12, 0.14) | 130,807 (58,196; 144,994) |
| 2 | Riparian areas | 200-ft | [1.6,2.5] | 2.2 (1.1, 2.3) | 16.5 (9.5, 17.4) | 0.13 (0.12, 0.13) | 57,164 (23,859; 62,254) |
| 2 | Riparian areas | 200-ft | (2.5,3.5] | 1.5 (0.6, 2.0) | 10.3 (4.2, 12.4) | 0.15 (0.13, 0.16) | 41,686 (19,355; 48,810) |
| 2 | Riparian areas | 200-ft | (3.5,4.7] | 1.6 (0.7, 1.9) | 12.7 (6.3, 13.6) | 0.13 (0.11, 0.14) | 31,957 (13,664; 36,223) |
| 2 | Riparian areas | 100-ft | NA | 2.5 (1.1, 2.9) | 36.6 (16.9, 40.7) | 0.07 (0.06, 0.07) | 113,171 (44,432; 131,597) |
| 2 | Riparian areas | 100-ft | [1.6,2.5] | 1.0 (0.5, 1.1) | 15.7 (8.5, 16.7) | 0.06 (0.06, 0.07) | 49,853 (19,086; 58,846) |
| 2 | Riparian areas | 100-ft | (2.5,3.5] | 0.8 (0.2, 1.0) | 9.1 (3.6, 11.3) | 0.08 (0.07, 0.09) | 34,692 (14,522; 43,007) |
| 2 | Riparian areas | 100-ft | (3.5,4.7] | 0.8 (0.3, 0.8) | 11.8 (4.8, 12.7) | 0.07 (0.07, 0.07) | 28,626 (9,758; 31,734) |
| 2 | Riparian areas | 50-ft | NA | 1.3 (0.5, 1.4) | 33.7 (14.2, 37.7) | 0.04 (0.03, 0.04) | 100,472 (32,587; 117,625) |
| 2 | Riparian areas | 50-ft | [1.6,2.5] | 0.5 (0.2, 0.5) | 14.5 (7.8, 15.3) | 0.03 (0.03, 0.03) | 44,895 (15,294; 51,004) |
| 2 | Riparian areas | 50-ft | (2.5,3.5] | 0.4 (0.1, 0.5) | 8.2 (2.8, 10.8) | 0.04 (0.03, 0.05) | 30,238 (8,979; 39,723) |
| 2 | Riparian areas | 50-ft | (3.5,4.7] | 0.4 (0.1, 0.4) | 11.0 (3.6, 11.6) | 0.04 (0.04, 0.04) | 25,338 (7,358; 28,450) |
| 3 | Retention basins | ogi_proj | NA | 0.2 (0.0, 0.2) | 4.4 (1.1, 5.2) | 0.04 (0.03, 0.04) | 14,635 (2,434; 18,365) |
| 3 | Retention basins | ogi_proj | [1.6,2.5] | 0.1 (0.0, 0.1) | 2.9 (0.8, 3.5) | 0.03 (0.02, 0.04) | 8,302 (1,240; 11,233) |
| 3 | Retention basins | ogi_proj | (2.5,3.5] | 0.0 (0.0, 0.0) | 1.0 (0.3, 1.0) | 0.04 (0.04, 0.06) | 4,783 (1,040; 5,348) |
| 3 | Retention basins | ogi_proj | (3.5,4.7] | 0.0 (0.0, 0.0) | 0.6 (0.4, 0.7) | 0.07 (0.07, 0.08) | 1,903 (1,229; 2,608) |
| 3 | Parcel regulations | parcel | NA | 1.0 (0.5, 1.0) | 55.5 (31.3, 57.8) | 0.02 (0.02, 0.02) | 209,137 (100,318; 220,942) |
| 3 | Parcel regulations | parcel | [1.6,2.5] | 0.4 (0.2, 0.4) | 20.8 (13.3, 21.2) | 0.02 (0.02, 0.02) | 77,296 (40,778; 82,007) |
| 3 | Parcel regulations | parcel | (2.5,3.5] | 0.2 (0.1, 0.2) | 16.2 (6.9, 16.8) | 0.01 (0.01, 0.02) | 70,583 (28,610; 74,841) |
| 3 | Parcel regulations | parcel | (3.5,4.7] | 0.4 (0.2, 0.4) | 18.5 (11.1, 19.8) | 0.02 (0.02, 0.02) | 61,258 (29,151; 66,940) |
| 4 | Parking | 100-pct | NA | 9.6 (9.5, 9.6) | 93.0 (89.4, 93.4) | 0.10 (0.10, 0.11) | 371,648 (357,783; 378,489) |
| 4 | Parking | 100-pct | [1.6,2.5] | 4.5 (4.4, 4.5) | 35.2 (34.5, 35.2) | 0.13 (0.13, 0.13) | 135,079 (129,964; 138,926) |
| 4 | Parking | 100-pct | (2.5,3.5] | 2.6 (2.6, 2.7) | 28.8 (27.5, 29.3) | 0.09 (0.09, 0.10) | 138,106 (130,663; 143,007) |
| 4 | Parking | 100-pct | (3.5,4.7] | 2.5 (2.4, 2.5) | 28.9 (27.3, 28.9) | 0.09 (0.09, 0.09) | 98,463 (93,299; 101,065) |
| 4 | Parking | 50-pct | NA | 9.6 (9.5, 9.6) | 93.0 (89.4, 93.4) | 0.10 (0.10, 0.11) | 371,648 (357,580; 378,027) |
| 4 | Parking | 50-pct | [1.6,2.5] | 4.5 (4.4, 4.5) | 35.2 (34.5, 35.2) | 0.13 (0.13, 0.13) | 135,079 (130,135; 138,537) |
| 4 | Parking | 50-pct | (2.5,3.5] | 2.6 (2.6, 2.7) | 28.8 (27.5, 29.3) | 0.09 (0.09, 0.10) | 138,106 (130,721; 142,599) |
| 4 | Parking | 50-pct | (3.5,4.7] | 2.5 (2.4, 2.5) | 28.9 (27.3, 28.9) | 0.09 (0.09, 0.09) | 98,463 (93,549; 101,454) |
| 4 | Parking | 30-pct | NA | 9.6 (9.5, 9.6) | 93.0 (89.4, 93.4) | 0.10 (0.10, 0.11) | 371,648 (357,231; 378,506) |
| 4 | Parking | 30-pct | [1.6,2.5] | 4.5 (4.4, 4.5) | 35.2 (34.5, 35.2) | 0.13 (0.13, 0.13) | 135,079 (129,864; 138,523) |
| 4 | Parking | 30-pct | (2.5,3.5] | 2.6 (2.6, 2.7) | 28.8 (27.5, 29.3) | 0.09 (0.09, 0.10) | 138,106 (131,056; 143,067) |
| 4 | Parking | 30-pct | (3.5,4.7] | 2.5 (2.4, 2.5) | 28.9 (27.3, 28.9) | 0.09 (0.09, 0.09) | 98,463 (93,440; 101,338) |
5.2 Table 2: NDVI at baseline, alternative, and difference therein
| Scenario num. | Scenario | Sub-scenario | Equity Tertile | Baseline NDVI, treatment area, median (95% UI) | Baseline NDVI, residential buffer, median (95% UI) | Alternative NDVI, residential buffer, median (95% UI) | Difference: NDVI, residential buffer, median (95% UI) |
|---|---|---|---|---|---|---|---|
| 1 | Block-group level | 100-pct | NA | 0.34 (0.26, 0.34) | 0.34 (0.26, 0.34) | 0.54 (0.38, 0.61) | 0.202 (0.120, 0.264) |
| 1 | Block-group level | 100-pct | [1.6,2.5] | 0.30 (0.25, 0.30) | 0.30 (0.25, 0.30) | 0.54 (0.38, 0.61) | 0.244 (0.127, 0.308) |
| 1 | Block-group level | 100-pct | (2.5,3.5] | 0.38 (0.28, 0.38) | 0.38 (0.28, 0.38) | 0.54 (0.38, 0.61) | 0.159 (0.095, 0.227) |
| 1 | Block-group level | 100-pct | (3.5,4.7] | 0.35 (0.25, 0.36) | 0.35 (0.25, 0.36) | 0.54 (0.38, 0.61) | 0.194 (0.126, 0.248) |
| 1 | Block-group level | 30-pct | NA | 0.34 (0.26, 0.34) | 0.34 (0.26, 0.34) | 0.40 (0.29, 0.42) | 0.061 (0.036, 0.079) |
| 1 | Block-group level | 30-pct | [1.6,2.5] | 0.30 (0.25, 0.30) | 0.30 (0.25, 0.30) | 0.37 (0.29, 0.39) | 0.073 (0.038, 0.092) |
| 1 | Block-group level | 30-pct | (2.5,3.5] | 0.38 (0.28, 0.38) | 0.38 (0.28, 0.38) | 0.43 (0.31, 0.45) | 0.048 (0.029, 0.068) |
| 1 | Block-group level | 30-pct | (3.5,4.7] | 0.35 (0.25, 0.36) | 0.35 (0.25, 0.36) | 0.40 (0.29, 0.43) | 0.058 (0.038, 0.075) |
| 1 | Block-group level | 20-pct | NA | 0.34 (0.26, 0.34) | 0.34 (0.26, 0.34) | 0.38 (0.28, 0.40) | 0.040 (0.024, 0.053) |
| 1 | Block-group level | 20-pct | [1.6,2.5] | 0.30 (0.25, 0.30) | 0.30 (0.25, 0.30) | 0.34 (0.27, 0.36) | 0.049 (0.025, 0.062) |
| 1 | Block-group level | 20-pct | (2.5,3.5] | 0.38 (0.28, 0.38) | 0.38 (0.28, 0.38) | 0.41 (0.30, 0.43) | 0.032 (0.019, 0.045) |
| 1 | Block-group level | 20-pct | (3.5,4.7] | 0.35 (0.25, 0.36) | 0.35 (0.25, 0.36) | 0.38 (0.28, 0.41) | 0.039 (0.025, 0.050) |
| 2 | Riparian areas | 200-ft | NA | 0.37 (0.28, 0.40) | 0.32 (0.24, 0.34) | 0.34 (0.25, 0.36) | 0.023 (0.012, 0.030) |
| 2 | Riparian areas | 200-ft | [1.6,2.5] | 0.36 (0.27, 0.37) | 0.29 (0.22, 0.31) | 0.32 (0.23, 0.34) | 0.024 (0.013, 0.031) |
| 2 | Riparian areas | 200-ft | (2.5,3.5] | 0.40 (0.27, 0.44) | 0.36 (0.29, 0.39) | 0.38 (0.30, 0.41) | 0.021 (0.015, 0.027) |
| 2 | Riparian areas | 200-ft | (3.5,4.7] | 0.37 (0.29, 0.39) | 0.31 (0.23, 0.33) | 0.34 (0.24, 0.36) | 0.022 (0.010, 0.029) |
| 2 | Riparian areas | 100-ft | NA | 0.38 (0.28, 0.41) | 0.31 (0.23, 0.33) | 0.32 (0.24, 0.34) | 0.011 (0.006, 0.014) |
| 2 | Riparian areas | 100-ft | [1.6,2.5] | 0.37 (0.28, 0.39) | 0.29 (0.21, 0.30) | 0.30 (0.22, 0.32) | 0.011 (0.006, 0.015) |
| 2 | Riparian areas | 100-ft | (2.5,3.5] | 0.41 (0.27, 0.45) | 0.36 (0.27, 0.38) | 0.37 (0.28, 0.40) | 0.011 (0.007, 0.013) |
| 2 | Riparian areas | 100-ft | (3.5,4.7] | 0.38 (0.30, 0.39) | 0.31 (0.24, 0.32) | 0.32 (0.25, 0.33) | 0.010 (0.005, 0.014) |
| 2 | Riparian areas | 50-ft | NA | 0.39 (0.27, 0.42) | 0.31 (0.22, 0.33) | 0.31 (0.23, 0.33) | 0.006 (0.003, 0.007) |
| 2 | Riparian areas | 50-ft | [1.6,2.5] | 0.38 (0.28, 0.39) | 0.28 (0.20, 0.29) | 0.29 (0.20, 0.30) | 0.006 (0.003, 0.008) |
| 2 | Riparian areas | 50-ft | (2.5,3.5] | 0.41 (0.26, 0.46) | 0.35 (0.26, 0.39) | 0.36 (0.27, 0.40) | 0.006 (0.004, 0.007) |
| 2 | Riparian areas | 50-ft | (3.5,4.7] | 0.39 (0.27, 0.39) | 0.31 (0.25, 0.31) | 0.31 (0.25, 0.32) | 0.005 (0.004, 0.007) |
| 3 | Retention basins | ogi_proj | NA | 0.43 (0.24, 0.46) | 0.31 (0.26, 0.32) | 0.31 (0.26, 0.32) | 0.003 (0.003, 0.005) |
| 3 | Retention basins | ogi_proj | [1.6,2.5] | 0.43 (0.29, 0.48) | 0.27 (0.25, 0.29) | 0.27 (0.25, 0.29) | 0.003 (0.002, 0.004) |
| 3 | Retention basins | ogi_proj | (2.5,3.5] | 0.31 (0.18, 0.31) | 0.37 (0.27, 0.37) | 0.37 (0.28, 0.37) | 0.008 (0.007, 0.009) |
| 3 | Retention basins | ogi_proj | (3.5,4.7] | 0.54 (0.54, 0.55) | 0.41 (0.40, 0.42) | 0.41 (0.40, 0.42) | 0.002 (0.000, 0.003) |
| 3 | Parcel regulations | parcel | NA | 0.30 (0.17, 0.31) | 0.34 (0.28, 0.34) | 0.34 (0.29, 0.34) | 0.002 (0.002, 0.003) |
| 3 | Parcel regulations | parcel | [1.6,2.5] | 0.25 (0.14, 0.27) | 0.29 (0.26, 0.30) | 0.30 (0.26, 0.30) | 0.003 (0.002, 0.003) |
| 3 | Parcel regulations | parcel | (2.5,3.5] | 0.31 (0.21, 0.31) | 0.38 (0.34, 0.38) | 0.38 (0.34, 0.38) | 0.001 (0.001, 0.002) |
| 3 | Parcel regulations | parcel | (3.5,4.7] | 0.35 (0.19, 0.35) | 0.35 (0.29, 0.36) | 0.35 (0.29, 0.36) | 0.002 (0.002, 0.003) |
| 4 | Parking | 100-pct | NA | 0.17 (0.17, 0.17) | 0.35 (0.34, 0.35) | 0.38 (0.36, 0.39) | 0.038 (0.022, 0.045) |
| 4 | Parking | 100-pct | [1.6,2.5] | 0.15 (0.15, 0.15) | 0.30 (0.30, 0.30) | 0.35 (0.33, 0.36) | 0.050 (0.029, 0.058) |
| 4 | Parking | 100-pct | (2.5,3.5] | 0.21 (0.21, 0.21) | 0.39 (0.38, 0.39) | 0.42 (0.40, 0.42) | 0.030 (0.016, 0.036) |
| 4 | Parking | 100-pct | (3.5,4.7] | 0.17 (0.16, 0.17) | 0.36 (0.35, 0.36) | 0.39 (0.37, 0.40) | 0.032 (0.019, 0.038) |
| 4 | Parking | 50-pct | NA | 0.17 (0.17, 0.17) | 0.35 (0.34, 0.35) | 0.36 (0.35, 0.37) | 0.019 (0.011, 0.022) |
| 4 | Parking | 50-pct | [1.6,2.5] | 0.15 (0.15, 0.15) | 0.30 (0.30, 0.30) | 0.33 (0.31, 0.33) | 0.025 (0.015, 0.029) |
| 4 | Parking | 50-pct | (2.5,3.5] | 0.21 (0.21, 0.21) | 0.39 (0.38, 0.39) | 0.40 (0.39, 0.40) | 0.015 (0.008, 0.018) |
| 4 | Parking | 50-pct | (3.5,4.7] | 0.17 (0.16, 0.17) | 0.36 (0.35, 0.36) | 0.38 (0.36, 0.38) | 0.016 (0.010, 0.019) |
| 4 | Parking | 30-pct | NA | 0.17 (0.17, 0.17) | 0.35 (0.34, 0.35) | 0.36 (0.35, 0.36) | 0.011 (0.007, 0.013) |
| 4 | Parking | 30-pct | [1.6,2.5] | 0.15 (0.15, 0.15) | 0.30 (0.30, 0.30) | 0.32 (0.31, 0.32) | 0.015 (0.009, 0.017) |
| 4 | Parking | 30-pct | (2.5,3.5] | 0.21 (0.21, 0.21) | 0.39 (0.38, 0.39) | 0.39 (0.39, 0.40) | 0.009 (0.005, 0.011) |
| 4 | Parking | 30-pct | (3.5,4.7] | 0.17 (0.16, 0.17) | 0.36 (0.35, 0.36) | 0.37 (0.35, 0.37) | 0.010 (0.006, 0.011) |
5.3 Table 3: Estimated deaths averted (total and rate per 100k) under each scenario
| Scenario num. | Scenario | Sub-scenario | Equity Tertile | Deaths prevented, estimate (95% UI) | Deaths prevented per 100k, estimate (95% UI) |
|---|---|---|---|---|---|
| 1 | Block-group level | 100-pct | NA | 302 (66, 447) | 78 (32, 114) |
| 1 | Block-group level | 100-pct | [1.6,2.5] | 114 (23, 169) | 81 (26, 118) |
| 1 | Block-group level | 100-pct | (2.5,3.5] | 110 (20, 167) | 77 (31, 116) |
| 1 | Block-group level | 100-pct | (3.5,4.7] | 78 (17, 126) | 78 (38, 119) |
| 1 | Block-group level | 30-pct | NA | 88 (20, 128) | 23 (10, 33) |
| 1 | Block-group level | 30-pct | [1.6,2.5] | 33 (7, 48) | 23 (8, 34) |
| 1 | Block-group level | 30-pct | (2.5,3.5] | 32 (6, 48) | 22 (9, 33) |
| 1 | Block-group level | 30-pct | (3.5,4.7] | 23 (5, 36) | 23 (12, 34) |
| 1 | Block-group level | 20-pct | NA | 58 (13, 85) | 15 (6, 22) |
| 1 | Block-group level | 20-pct | [1.6,2.5] | 22 (5, 32) | 16 (5, 22) |
| 1 | Block-group level | 20-pct | (2.5,3.5] | 21 (4, 32) | 15 (6, 22) |
| 1 | Block-group level | 20-pct | (3.5,4.7] | 15 (3, 24) | 15 (7, 23) |
| 2 | Riparian areas | 200-ft | NA | 13 (2, 20) | 10 (4, 14) |
| 2 | Riparian areas | 200-ft | [1.6,2.5] | 4 (1, 8) | 8 (3, 12) |
| 2 | Riparian areas | 200-ft | (2.5,3.5] | 5 (1, 8) | 11 (4, 17) |
| 2 | Riparian areas | 200-ft | (3.5,4.7] | 3 (1, 6) | 11 (4, 16) |
| 2 | Riparian areas | 100-ft | NA | 5 (1, 8) | 4 (2, 7) |
| 2 | Riparian areas | 100-ft | [1.6,2.5] | 2 (0, 3) | 3 (1, 5) |
| 2 | Riparian areas | 100-ft | (2.5,3.5] | 2 (0, 3) | 5 (2, 8) |
| 2 | Riparian areas | 100-ft | (3.5,4.7] | 2 (0, 3) | 5 (2, 8) |
| 2 | Riparian areas | 50-ft | NA | 2 (0, 4) | 2 (1, 3) |
| 2 | Riparian areas | 50-ft | [1.6,2.5] | 1 (0, 1) | 2 (1, 3) |
| 2 | Riparian areas | 50-ft | (2.5,3.5] | 1 (0, 1) | 3 (1, 4) |
| 2 | Riparian areas | 50-ft | (3.5,4.7] | 1 (0, 1) | 3 (1, 5) |
| 3 | Retention basins | ogi_proj | NA | 0 (0, 1) | 2 (1, 3) |
| 3 | Retention basins | ogi_proj | [1.6,2.5] | 0 (0, 0) | 1 (0, 2) |
| 3 | Retention basins | ogi_proj | (2.5,3.5] | 0 (0, 0) | 5 (3, 8) |
| 3 | Retention basins | ogi_proj | (3.5,4.7] | 0 (0, 0) | 1 (0, 3) |
| 3 | Parcel regulations | parcel | NA | 1 (0, 2) | 1 (0, 1) |
| 3 | Parcel regulations | parcel | [1.6,2.5] | 1 (0, 1) | 1 (0, 1) |
| 3 | Parcel regulations | parcel | (2.5,3.5] | 0 (0, 1) | 0 (0, 1) |
| 3 | Parcel regulations | parcel | (3.5,4.7] | 0 (0, 1) | 1 (0, 1) |
| 4 | Parking | 100-pct | NA | 48 (23, 61) | 13 (6, 16) |
| 4 | Parking | 100-pct | [1.6,2.5] | 18 (9, 24) | 13 (6, 18) |
| 4 | Parking | 100-pct | (2.5,3.5] | 20 (9, 26) | 14 (7, 19) |
| 4 | Parking | 100-pct | (3.5,4.7] | 10 (5, 14) | 11 (5, 15) |
| 4 | Parking | 50-pct | NA | 24 (12, 31) | 6 (3, 8) |
| 4 | Parking | 50-pct | [1.6,2.5] | 9 (4, 12) | 7 (3, 9) |
| 4 | Parking | 50-pct | (2.5,3.5] | 10 (4, 13) | 7 (3, 9) |
| 4 | Parking | 50-pct | (3.5,4.7] | 5 (2, 7) | 5 (2, 7) |
| 4 | Parking | 30-pct | NA | 14 (7, 18) | 4 (2, 5) |
| 4 | Parking | 30-pct | [1.6,2.5] | 5 (3, 7) | 4 (2, 5) |
| 4 | Parking | 30-pct | (2.5,3.5] | 6 (3, 8) | 4 (2, 5) |
| 4 | Parking | 30-pct | (3.5,4.7] | 3 (1, 4) | 3 (1, 4) |
References
Copyright © 2024 Michael D. Garber